Baltic Ice Lake
At the peak of the Baltic Ice Lake's high-water phase, present-day Helsinki lay submerged under more than a hundred feet of freshwater. Most of Finland had vanished beneath the surface. Only southern Sweden stood both free of ice and above the waterline, an island in a frozen world that Greco-Roman geographers would later call Scandza. This immense lake, trapped between retreating glaciers and rising land, existed for over four thousand years before it finally broke through to the world ocean in a catastrophic flood. The event happened around 11,620 years ago near Mount Billingen in what is now southwestern Sweden, and when the waters equalized with the rising sea, the Baltic Ice Lake ceased to exist.
The Weight of Ice
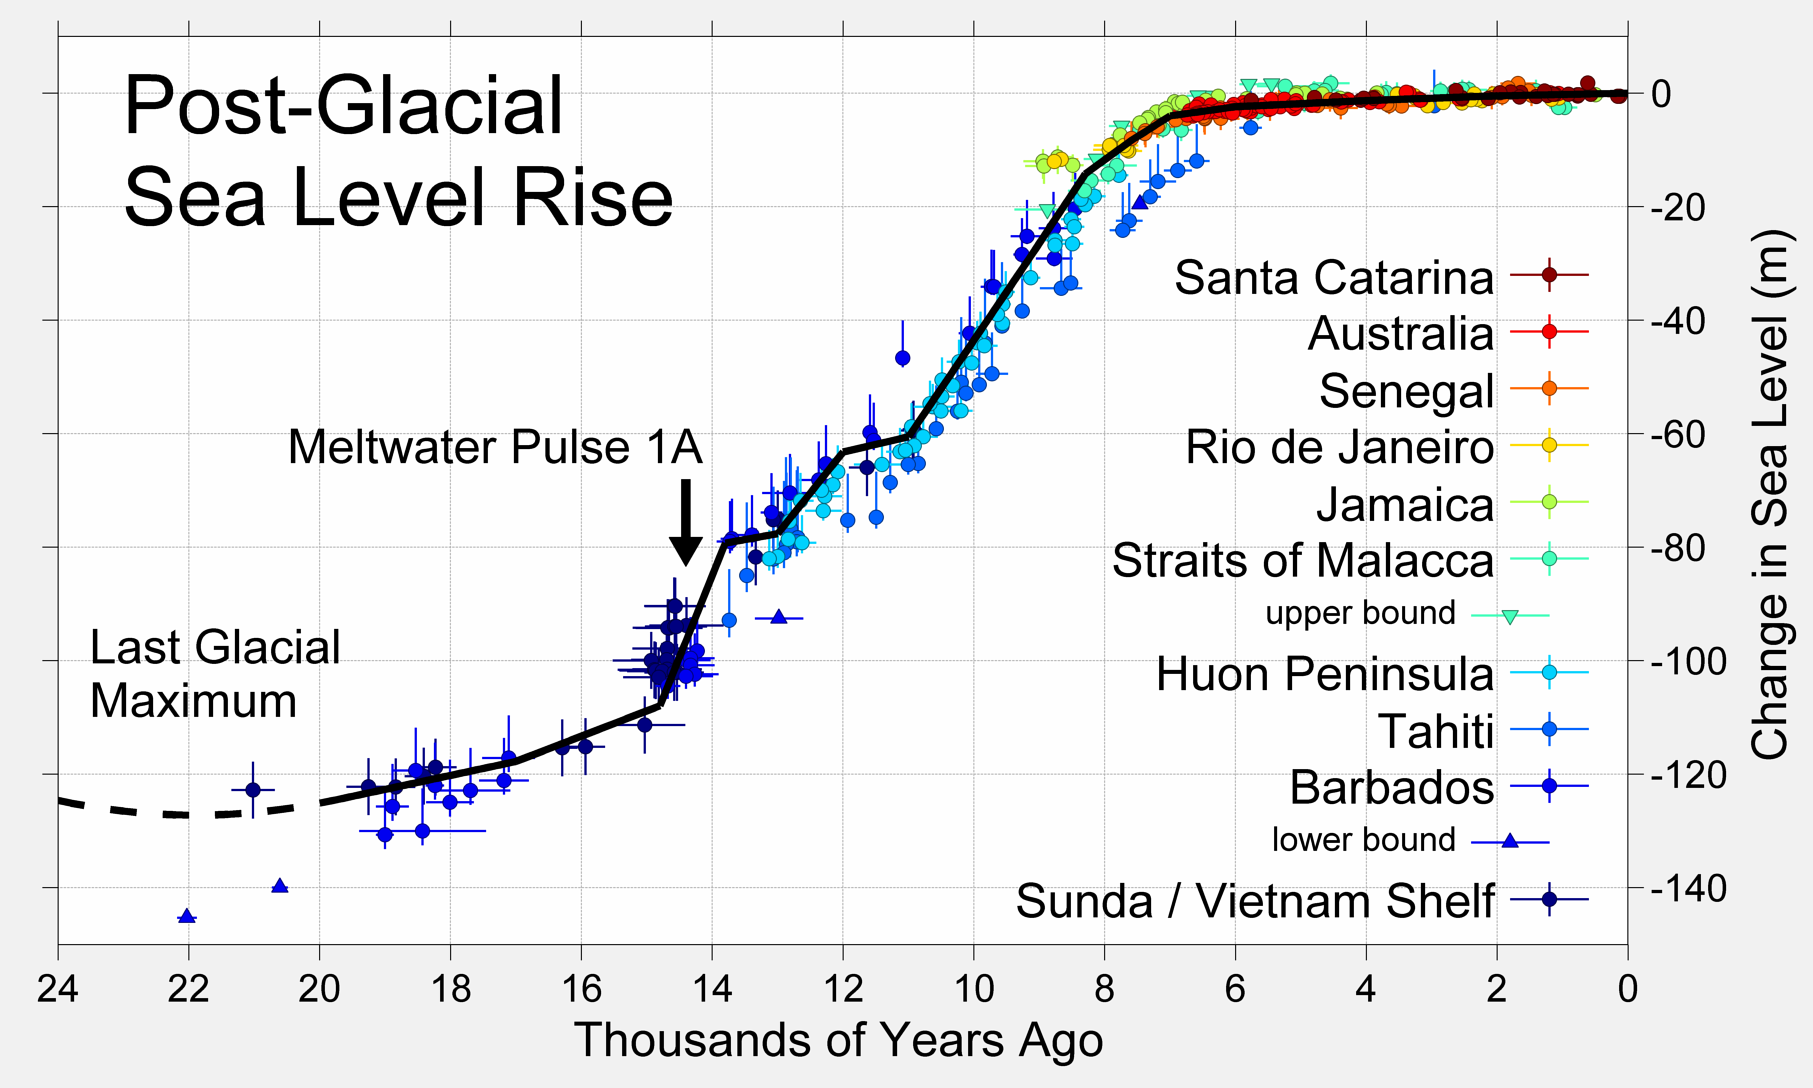
Twenty-two thousand years ago, the Weichselian ice sheet reached its maximum extent, and sea levels dropped to 120 meters below their present mark. The Baltic Basin had seen many lakes form and disappear during the glacial period, but the lake that would define the region's transition to the modern era began taking shape around 16,000 years ago. As the glacier retreated from the moraines of Pomerania in present-day northern Poland, meltwater pooled in the southern Baltic region. The ice continued its slow withdrawal northward. By 13,600 years ago, the lake had formed in the deepest part of today's Baltic Sea at Landsort Deep, which plunges 459 meters below present sea level. The landscape was responding to two competing forces: the glacier's retreat releasing water, and the land beneath springing upward once freed from the ice's crushing weight.
A Sea That Was Not a Sea
The term lake distinguished this body of water from the brackish and salty seas that would follow. Geologists determine ancient water conditions through the fossils left behind. Diatoms, microscopic algae preserved in sediment, reveal whether the water was fresh or saline. Some species require salt; others cannot tolerate it. The Baltic Ice Lake's sediments tell of freshwater conditions, poor in organic matter, suggesting shores that offered little to attract human settlement. The algae Chara thrived in these waters around 13,500 years ago before declining sharply. Pine and birch pollen from the surrounding tundra and taiga drifted onto the lake's surface and settled to the bottom, creating a record of a cold, spare landscape where juniper grew between 12,650 and 11,200 years ago.
The First Drainage
The lake was not stable. During the Allerod warm period, rising land in the Denmark region created a dam that ponded the waters in the Baltic Basin. The lake level climbed tens of meters above the contemporary sea level. Then, around 12,900 years ago, the lake drained at an unknown location, dropping between 5 and 10 meters before rising again. By this time, the waters extended across much of the present southern Baltic shoreline and incorporated the area around present-day Lake Ladoga. The gulfs of Bothnia and Finland remained locked under glacial ice, as did nearly all of Sweden north of Scania. The Danish Islands west of the Oresund Strait were all connected. Fresh water continued accumulating as the ice melted.
The Final Breakout
For decades, quaternary geologists described the final drainage as a single catastrophic event, a tap of Niagara-like force that burst through near Mount Billingen in southwestern Sweden. Modern research reveals a more complex picture. The breakout happened in several steps over months or perhaps years, with water finding paths along the ice margin, over the glacier's surface, and through tunnels beneath it. Flow velocities peaked at 5 to 7 meters per second during the first few months. Peak discharge rates reached approximately 8,000 cubic meters per second. When the lake level finally equalized with the rising world ocean around 11,620 years ago, salt water began entering through the passage at Billingen. The Baltic Ice Lake became the Yoldia Sea, beginning a sequence of alternating lakes and seas that would eventually produce the modern Baltic.
Traces Left Behind
The distribution of certain freshwater species in Swedish highland lakes today may trace back to seeding during the Baltic Ice Lake's high stand. Black varves in sediment cores mark the transition to higher carbon content when the lake reached sea level. Layers containing cod fossils and marine diatoms record the moment salt water arrived. The Riadino-5 archaeological site in Kaliningrad Oblast shows humans lived on the borders of the Baltic Basin between 50,000 and 44,000 years ago, but no settlements have been identified directly connected to the Baltic Ice Lake. The earliest dated site near Parnu in Estonia appears about 100 years before 10,700 years ago, on the shores of the succeeding Yoldia Sea. The ice lake's barren shores apparently attracted no one, but when the waters changed and fishing became possible, humans arrived.
From the Air
The Baltic Ice Lake covered the area of the modern Baltic Sea, centered approximately at 58.0N, 20.0E. From altitude, the entire Baltic Sea basin represents the lake's former extent. Key landmarks include the Swedish coastline near Billingen where the final breakout occurred, the deep waters off Sweden at Landsort Deep, and the Gulf of Riga where Latvia meets the sea. Major airports in the region include Stockholm Arlanda (ESSA), Riga (EVRA), Tallinn (EETN), and Helsinki (EFHK). Best appreciated from high altitude (FL200+) where the basin's full extent becomes visible.